Cambridge Primary Checkpoint · Science 0097 · Stage 6 · Working scientifically
Thinking and Working Scientifically: Investigations, Variables, Tables and Graphs
How to plan a fair test, name the variables, measure accurately, record results, draw the right graph, spot anomalous results, write conclusions and improve an investigation — the skills that appear in almost every Checkpoint question.
British & IGCSE › Checkpoint 6 › Checkpoint 6 Science — Complete Course
- Explain how a model helps us understand and describe a scientific idea (6TWSm.01)
- Use models, including diagrams, to show and describe scientific ideas (6TWSm.02)
- Ask scientific questions and choose a suitable type of enquiry (6TWSp.01)
- Know the five main types of enquiry: research, fair testing, observing over time, identifying and classifying, pattern seeking (6TWSp.02)
- Make predictions using your science knowledge, in familiar and new situations (6TWSp.03)
- Plan fair tests and name the independent, dependent and control variables (6TWSp.04)
- Describe the risks in practical work and how to make them smaller (6TWSp.05)
- Sort, group and classify objects, materials and living things by testing, observing and using secondary information (6TWSc.01)
- Complete a key using differences that are easy to see (6TWSc.02)
- Choose suitable equipment and use it correctly (6TWSc.03)
- Decide when to repeat observations or measurements to make data more reliable (6TWSc.04)
- Take measurements that are accurate enough (6TWSc.05)
- Carry out practical work safely (6TWSc.06)
- Use different secondary sources to research and choose relevant evidence (6TWSc.07)
- Record observations and measurements in suitable tables and diagrams (6TWSc.08)
- Say how accurate your prediction was, using the results (6TWSa.01)
- Describe patterns in results and spot anomalous results (6TWSa.02)
- Make a conclusion from results using your science knowledge (6TWSa.03)
- Suggest how to improve an investigation and explain why (6TWSa.04)
- Present and read results in tables, bar charts, dot plots, line graphs and scatter graphs (6TWSa.05)
- Use the correct units and symbols: mm, cm, m, km, cm², m², ml, l, cm³, m³, g, kg, N, N/kg, s, min, h, °C (Stage 6 appendix)
Almost every Checkpoint Science question has a part about how science is done: naming a variable, completing a table, reading a graph, finding an odd result or suggesting an improvement. These marks are easy to win once you know the rules on this page.
| Word / phrase | Meaning / use |
|---|---|
| variable | متغيّر — anything that can change in an investigation |
| independent variable | المتغيّر المستقل — the one thing YOU change |
| dependent variable | المتغيّر التابع — the thing you MEASURE or observe |
| control variables | المتغيّرات الثابتة (المضبوطة) — things you keep the SAME |
| fair test | تجربة عادلة — only one variable is changed |
| prediction | توقّع — what you think will happen, with a reason |
| hypothesis | فرضية — a scientific idea that might explain something and can be tested |
| hazard / risk | مصدر خطر / خطر — something that could cause harm / how likely harm is |
| reliable | موثوق — you get similar results when you repeat |
| accurate | دقيق — close to the true value |
| anomalous result | نتيجة شاذة — a result that does not fit the pattern |
| mean | المتوسط الحسابي — add the values, divide by how many |
| conclusion | استنتاج — what the results show, with a scientific reason |
| evaluate | يقيّم — say what was good and what could be better |
| secondary source | مصدر ثانوي — information from books, websites or experts, not your own test |
| model | نموذج — something that represents a real thing or idea to help explain it |
1. Scientific questions and the five types of enquiry
A scientific question is one you can answer by collecting evidence. "Which is the most beautiful rock?" is not scientific (it is an opinion). "Which rock soaks up the most water?" is scientific — you can test it. Once you have a question, choose the type of enquiry that can answer it.
| Type of enquiry | Key features | Example question |
|---|---|---|
| Fair testing | You change ONE variable, measure another and keep all the others the same. | Does the temperature of water affect how fast sugar dissolves? |
| Observing over time | You watch the same thing and record changes at regular times (minutes, days, months). | How does the shape of the Moon change over a month? |
| Pattern seeking | You cannot control the variables, so you collect data from many people, places or things and look for a link. | Do taller children have longer arm spans? |
| Identifying and classifying | You sort things into groups by their features, often using a key. | Is this rock igneous, sedimentary or metamorphic? |
| Research | You use secondary sources to answer questions you cannot test (too big, too far, too slow, too dangerous, or about the past). | How do fossils of sea animals end up on mountains? |
How to choose: Can you change one thing and keep everything else the same? → fair test. Is it about change over time? → observing over time. Is it about many living things or places that you cannot control? → pattern seeking. Are you sorting or naming? → identifying and classifying. Can you not test it yourself? → research.
2. Models and diagrams
A model represents something real so that we can understand it. Models are useful when the real thing is too small (particles), too big or too far (the Solar System), hidden inside the body (heart and lungs), or too slow (the rock cycle). A diagram is a kind of model.
| Model | What it helps us understand | How it is different from the real thing (its limits) |
|---|---|---|
| Balls in a box for particles | Particles in a solid are close and in rows; in a gas they are far apart and move fast. | Real particles are far too small to see and they are not coloured balls. |
| A ball and a lamp for the Moon and Sun | Why the Moon seems to change shape: we see different amounts of its lit half. | Sizes and distances are completely wrong. |
| Two balloons in a bottle for the lungs | Air goes in when the space in the chest gets bigger. | Real lungs are not hollow bags; they have millions of tiny air sacs. |
| A food web diagram | Who eats whom, and how energy passes along. | It does not show how many of each animal there are. |
In the test you may be asked to use a model ("draw the particles", "draw the force arrows", "complete the circuit diagram") or to say how a model helps ("it shows … that we cannot see") and one way it is not like the real thing.
3. Predictions and hypotheses
A prediction says what you think will happen and why, using science you know. A good prediction has two parts: I predict that … because …. A hypothesis is the scientific idea behind it — an explanation that can be tested.
- Weak: "I think the sugar will dissolve." (no comparison, no reason)
- Good: "I predict that sugar will dissolve faster in hotter water, because the water particles move faster and break up the sugar more quickly."
- In a new (unfamiliar) context, still use science: "I predict the plant in sandy soil will wilt first, because sand does not hold much water."
4. Variables and fair tests
In a fair test you change only one variable, so you know that it caused any difference in your results.
| Variable | Question to ask yourself | Sugar-dissolving example |
|---|---|---|
| Independent variable | What do I change? | the temperature of the water |
| Dependent variable | What do I measure (or observe)? | the time for the sugar to dissolve |
| Control variables | What must I keep the same? | volume of water (100 ml); mass of sugar (5 g); type of sugar; stirring (same number of stirs); same type of beaker |
- Write the independent variable as "the ___ of the ___" (the temperature of the water) — never just "the water".
- The dependent variable is usually something you read from an instrument: a time, a distance, a temperature, a mass.
- For control variables, name a quantity, and if possible give its value: "the same volume of water, 100 ml".
- If a question says "Why is it a fair test?", answer: "Only one variable (the ___) was changed; everything else was kept the same."
المتغيّر المستقل = الحاجة اللي أنا بغيّرها بإيدي. المتغيّر التابع = الحاجة اللي بقيسها (وقت، مسافة، درجة حرارة). المتغيّرات الثابتة = كل حاجة تانية لازم تفضل زي ما هي عشان التجربة تبقى عادلة. واكتب دايمًا "the temperature of the water" مش "the water" بس.
5. Risks and safety
A hazard is something that could cause harm (hot water, glass). A risk is the chance that harm happens. Before practical work, describe each risk and say how to minimise it.
| Hazard | Risk | How to make the risk smaller |
|---|---|---|
| Hot water from a kettle | Scalding (burning) the skin | An adult pours it; keep beakers on a heatproof mat in the middle of the table; do not carry hot water around |
| Glass beakers or thermometers | Cuts if they break | Hold them carefully; lay a thermometer so it cannot roll; tell the teacher about breakages; do not pick up glass with your fingers |
| Water spilled on the floor | Slipping | Wipe spills at once |
| Toy car or falling objects | Hitting feet or people | Keep the area clear; stand to the side |
| Soil or mouldy food | Germs entering the body | Wear gloves; wash hands with soap afterwards |
Exam tip: name the hazard AND the action. "Be careful" earns nothing. "Hot water could burn you, so let an adult pour it" earns marks.
6. Choosing equipment and measuring accurately
| To measure… | Use… | Units |
|---|---|---|
| length / distance | ruler, metre rule, tape measure | mm, cm, m (km for long distances) |
| volume of a liquid | measuring cylinder (or measuring jug) | ml, l (1 ml = 1 cm³) |
| mass | balance (scales) | g, kg |
| weight or force | forcemeter (newton meter) | N (newtons) |
| temperature | thermometer (or temperature sensor) | °C |
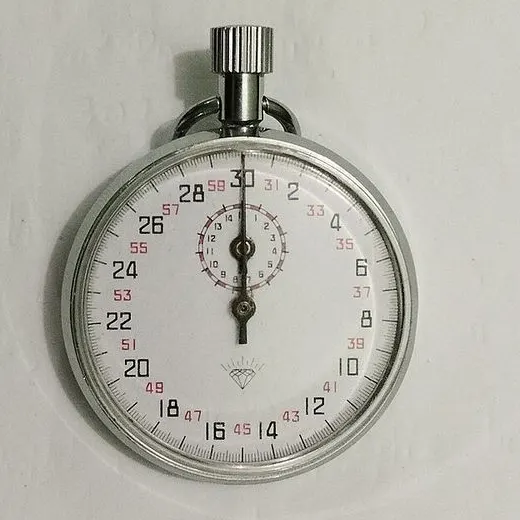
| time | stopwatch, timer | s, min, h |
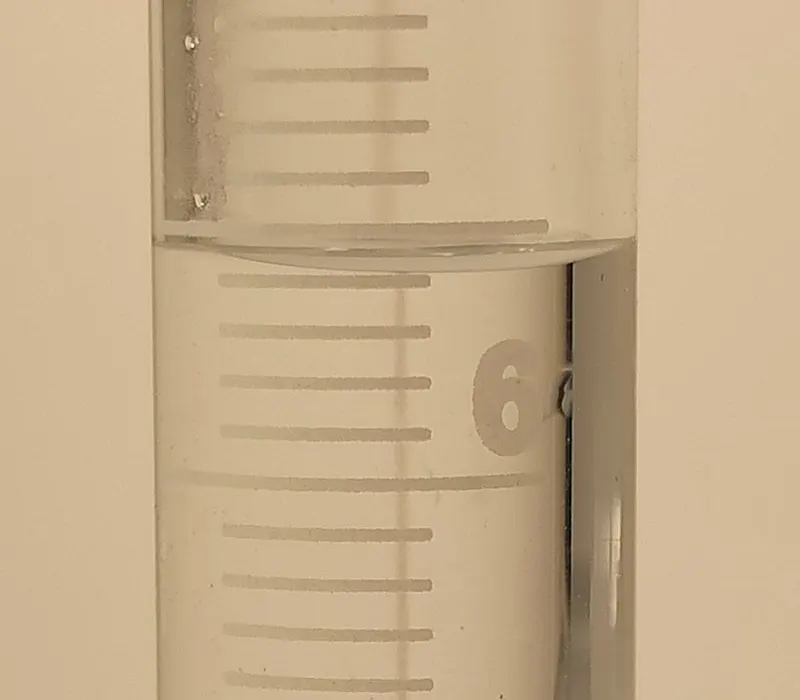
Choose equipment with a suitable scale: use a 100 ml measuring cylinder (not a bucket) for 50 ml of water; use a stopwatch, not a wall clock, for a 10-second time. Then read it carefully:
- Work out what one small division is worth (count the gaps between two numbers).
- Read with your eye level with the reading (for a liquid, the bottom of the curved surface, called the meniscus).
- Start a ruler at 0, not at the edge of the ruler. Set a balance to zero before adding the object.
- Write the value and the unit.
7. Units you must know
The prefixes tell you the size: milli (m) = one thousandth, centi (c) = one hundredth, kilo (k) = one thousand.
| Quantity | Units and symbols | Useful facts |
|---|---|---|
| Length | millimetre (mm), centimetre (cm), metre (m), kilometre (km) | 10 mm = 1 cm; 100 cm = 1 m; 1000 m = 1 km |
| Area | square centimetre (cm²), square metre (m²) | area of a rectangle = length × width |
| Volume | millilitre (ml), litre (l), cubic centimetre (cm³), cubic metre (m³) | 1000 ml = 1 l; 1 ml = 1 cm³ |
| Mass | gram (g), kilogram (kg) | 1000 g = 1 kg |
| Weight and other forces | newton (N) | weight is a force, so it is measured in N |
| Strength of gravity | newtons per kilogram (N/kg) | about 10 N/kg on Earth |
| Time | second (s), minute (min), hour (h) | 60 s = 1 min; 60 min = 1 h |
| Temperature | degrees Celsius (°C) | water freezes at 0 °C and boils at 100 °C |
To change a big unit into a small one, multiply (2.5 kg = 2.5 × 1000 = 2500 g). To change a small unit into a big one, divide (350 cm = 350 ÷ 100 = 3.5 m).
8. Repeating measurements
Measurements are rarely exactly the same each time (you press the stopwatch a bit late, the car leaves the ramp slightly differently). Repeating a measurement (usually three times) and working out the mean makes the data more reliable. Repeat when results vary a lot, when a result looks odd, or when the measurement is quick and easy to get slightly wrong (like timing).
Mean = add the values ÷ how many values. Leave out any anomalous result before you work out the mean.
9. Sorting, classifying and using keys
We can sort and classify objects, materials and living things by testing (Does a magnet attract it? Does it let electricity through?), by observing (Does it have legs? Is it shiny?) and by using secondary information (a book says whales breathe with lungs, so they are mammals, not fish). A key is a set of yes/no questions about features that are easy to see. Each question splits the group in two until each thing has its own name.
- Use features you can see (legs, shell, colour, wings), not ones you cannot ("Is it fast?", "Is it dangerous?").
- Each question must have only two answers (yes / no).
- When you complete a key, check that every living thing ends in its own box.
10. Secondary sources
Secondary sources are information that someone else collected: books, reliable websites, encyclopaedias, videos from science organisations, data tables, or an expert (a doctor, a farmer, a geologist). Use them when you cannot test something yourself.
- Use more than one source and check that they agree.
- Check who wrote it (a science organisation, a museum or a university is more reliable than an advert or a random post) and when (is it up to date?).
- Pick only the evidence that is relevant to your question, and write it in your own words.
11. Recording results in tables
| temperature of water in °C | time 1 in s | time 2 in s | time 3 in s | mean time in s |
|---|---|---|---|---|
| 20 | 118 | 122 | 120 | 120 |
| 40 | 75 | 78 | 75 | 76 |
| 60 | 50 | 47 | 47 | 48 |
- Put the independent variable in the first column, in order (20, 40, 60).
- Put the dependent variable in the next columns, with a column for each repeat and one for the mean.
- Write the unit in the heading (in °C, in s), not after every number.
- Use a ruler and give every column a heading.
Check the means: (118 + 122 + 120) ÷ 3 = 360 ÷ 3 = 120; (75 + 78 + 75) ÷ 3 = 228 ÷ 3 = 76; (50 + 47 + 47) ÷ 3 = 144 ÷ 3 = 48. For some enquiries a labelled diagram is better than a table — for example, drawing the Moon's shape each night.
12. Choosing the right chart or graph
| Chart | Use it when… | Example |
|---|---|---|
| Bar chart | the independent variable is in words (categories) | distance a car rolls on carpet, sand, wood, tiles |
| Line graph | both variables are numbers and the independent variable can take any value (or it is time) | time to dissolve at 20, 30, 40… °C; temperature every minute |
| Scatter graph | you measure two things about many individuals to look for a pattern (pattern seeking). Points are NOT joined. | height and arm span of 10 children |
| Dot plot | you want to show how often each value appears | number of peas in each of 12 pods |
Drawing a graph: independent variable on the x-axis (across), dependent on the y-axis (up); label both axes with the unit; choose a scale that goes up in equal steps and uses most of the grid; plot points as small crosses in pencil, exactly; draw bars of equal width with gaps for a bar chart.
13. Patterns, anomalous results and conclusions
Describe a pattern with "As … increases, … increases / decreases", then add numbers from the data. From the line graph: "As the temperature of the water increases, the time for the sugar to dissolve decreases — from 120 s at 20 °C to 48 s at 60 °C."
An anomalous result does not fit the pattern (80 s at 50 °C should be about 60 s). It may be caused by a mistake: the timer started late, the sugar was not stirred, or less hot water was used. What to do: repeat that measurement, and leave it out of the mean and the line.
A conclusion answers the question of the investigation and explains it with science: "Sugar dissolves faster in hotter water, because the particles of water move faster and break up the sugar more quickly." Then compare with your prediction: "My prediction was correct: I said hotter water would dissolve sugar faster, and the time went down from 120 s to 48 s." If only part of the prediction was right, say which part.
النتيجة الشاذة (anomalous) هي النتيجة اللي مش ماشية مع باقي النتايج. بنعيد القياس ده، وما بندخلهوش في حساب المتوسط. والاستنتاج لازم يرد على سؤال التجربة ويقول السبب العلمي بكلمة because.
14. Evaluating and improving an investigation
To improve an investigation, say what to change and why it helps:
| Problem | Improvement | Why it helps |
|---|---|---|
| Each measurement done only once | Repeat each measurement three times and work out the mean | Results are more reliable; odd results can be spotted |
| "One spoon" of sugar (spoons can be fuller or emptier) | Measure 5 g of sugar on a balance each time | Keeps a control variable really the same, so the test is fairer |
| Times measured by counting | Use a stopwatch | Measurements are more accurate |
| Only three temperatures tested | Test more temperatures, e.g. every 10 °C from 20 °C to 70 °C | The pattern is clearer; you can see where an odd result is |
| Some beakers stirred, some not | Stir every beaker the same number of times | Only the temperature changes — a fair test |
Worked examples
Worked example 1 (variables)
Mona investigates how the mass of plasticine on a paper boat affects how deep the boat sinks into water. She adds 10 g, 20 g, 30 g and 40 g of plasticine and measures how far the boat sinks below the water surface. (a) Name the independent variable. [1] (b) Name the dependent variable. [1] (c) Name two variables Mona must keep the same. [2]
- (a) What does Mona change? → the mass of plasticine (on the boat).
- (b) What does she measure? → how deep the boat sinks (the distance below the water surface).
- (c) Things that could also change the result: the same paper boat (size and shape), the same type of paper, the same water (type and depth), plasticine put in the same place on the boat. Any two = 2 marks.
Common mistake: writing "the plasticine" for (a). Say what about it changes: its mass.
Worked example 2 (prediction and its accuracy)
Before the dissolving investigation (line graph above), Sami predicted: "Sugar will dissolve faster in hotter water." (a) Add a scientific reason to Sami's prediction. [1] (b) Was his prediction correct? Use the results to explain. [2]
- (a) "… because the particles move faster in hot water."
- (b) Yes, the prediction was correct [1]: the time to dissolve went down as the temperature went up, from 120 s at 20 °C to 48 s at 60 °C [1].
- A full answer can also mention that the result at 50 °C did not fit and should be repeated.
Worked example 3 (repeats, anomalous result and mean)
Ali times how long an ice cube takes to melt in three places. He repeats each one three times.
| place | time 1 in min | time 2 in min | time 3 in min | mean in min |
|---|---|---|---|---|
| sunny windowsill | 12 | 13 | 11 | 12 |
| classroom table | 20 | 19 | 27 | ? |
| shady corridor | 15 | 16 | 14 | 15 |
(a) Which result is anomalous? [1] (b) Work out the mean for the classroom table, leaving out the anomalous result. [1] (c) Why did Ali repeat each measurement? [1]
- (a) 27 min — the other two classroom results are 19 and 20, so 27 does not fit.
- (b) (20 + 19) ÷ 2 = 39 ÷ 2 = 19.5 min.
- (c) To make the results more reliable / to spot an anomalous result.
Common mistake: dividing by 3 after leaving out a value. You only added two values, so divide by 2.
Worked example 4 (choosing a graph and describing a pattern)
(a) Yara measured the distance a toy car rolled on four surfaces. Which type of graph should she draw? Give a reason. [1] (b) Describe the pattern shown in the scatter graph of height and arm span. [1]
- (a) A bar chart, because the type of surface is a word (category), not a number.
- (b) As height increases, arm span increases (taller children have longer arm spans).
Worked example 5 (risks)
Ahmed uses water from a kettle at 60 °C in glass beakers. Describe one risk and how to reduce it. [2]
- Risk [1]: hot water could scald / burn his skin (or: the glass beaker could break and cut him).
- Action [1]: an adult pours the hot water / keep the beaker on a heatproof mat away from the edge (or: handle glass carefully and report breakages).
Worked example 6 (improving an investigation)
Sara added "one spoon of sugar" to each beaker and timed each beaker once. Suggest one improvement and explain why it helps. [2]
- Improvement [1]: measure the same mass of sugar (for example 5 g) with a balance. Why [1]: spoons hold different amounts, so this keeps a control variable the same and makes the test fair.
- Or: repeat each temperature three times and calculate a mean [1], because this makes the results more reliable [1].
- Mixing up independent (change) and dependent (measure). Say: "I change the independent; I measure the dependent."
- Writing vague variables: "the water" instead of "the temperature of the water" or "the volume of water".
- Writing "to make it fair" as the reason for repeating. Repeating makes results reliable; keeping control variables the same makes the test fair.
- Drawing a line graph for categories (words) — use a bar chart.
- Joining the points on a scatter graph.
- Including an anomalous result in the mean, or dividing by the wrong number.
- Reading a scale without working out what one small division is worth.
- Forgetting the unit, or using kg for weight (weight is in newtons, N).
- "Name the variable that … changes / measures / keeps the same." — use the exact words from the question.
- "Write a prediction" — use "I predict … because …".
- "Complete the table" — copy values exactly; add the mean; headings need units.
- "Circle the anomalous result" or "Which result does not fit the pattern?" — compare with the other repeats or with the line.
- "Describe the pattern" — "As … increases, … increases/decreases", with two numbers from the data.
- "Suggest one way to improve" — WHAT to change + WHY it helps (two marks).
- "Read the thermometer / measuring cylinder" — find the value of one small division first.
- "Which type of enquiry?" — fair test, observing over time, pattern seeking, identifying and classifying, research.
Practice
- Independent = what you change; dependent = what you measure; control = what you keep the same. A fair test changes only one variable.
- Prediction = "I predict … because …" (use science). Conclusion = answer the question + scientific reason + compare with the prediction.
- Repeat measurements and take the mean to make results reliable; leave anomalous results out of the mean.
- Bar chart for categories, line graph for numbers, scatter graph for pattern seeking (points not joined), dot plot for how often each value appears.
- Read scales carefully (value of one small division, eye level) and always write the unit: mass in g or kg, weight in N, temperature in °C.
- Improvement = what to change + why it helps.
All pages in this course
Start here
- Checkpoint 6 Science: The Test and How to Prepare
- Thinking and Working Scientifically: Investigations, Variables, Tables and Graphs
Biology
- The Heart and Circulatory System
- The Lungs and Respiratory System
- Human Reproductive System and Puberty
- Diseases, Hygiene and the Body's Defences
- Food Chains, Food Webs, Energy and Toxins
Chemistry
- Properties of Substances: Melting and Boiling Points, Gases, Conductors
- Reversible Changes and Dissolving
- Boiling and Evaporation
- Chemical Reactions: Reactants, Products and Evidence
Physics
- Mass, Weight and Gravity
- Force Diagrams and Forces on Moving Objects
- Floating and Sinking
- Light: Reflection and Refraction
- Electric Circuits, Symbols, Series and Parallel
Earth and space
Practice tests